What your asset data can already tell you.
Every inspection your team completes, every asset they map, every bin they empty leaves a record. Most councils treat that as a compliance trail. It is also an operational answer waiting to be read.
This is work a council would normally pay a consultancy for, done from data you already have.
A consultancy has to go and gather the data before it can tell you anything. Surveys, site visits, someone with a clipboard walking your estate for a fortnight. That is what makes the job cost thousands of pounds and take months, and it is why most councils never commission one.
If your assets are already mapped and your team is already recording what they find, the expensive part is done. What is left is arithmetic, and arithmetic is cheap.
Collection rounds
Are your rounds matched to how fast the bins actually fill?
Most collection schedules were set years ago and have never been revisited. Every bin on the round gets the same visit, whether it is overflowing or empty.
If your crew records how full each bin was when they emptied it, that question answers itself. Ten weeks of a single round, one row per bin, ranked by average fullness:
What this reveals
Which bins are being emptied when they are barely used, and which are arriving full again and again. Usually the answer is not a smaller service but a rebalanced one: some bins drop a tier, others need visiting more often. It also shows whether a round is under-resourced, which is the thing a crew already knows and cannot easily prove.
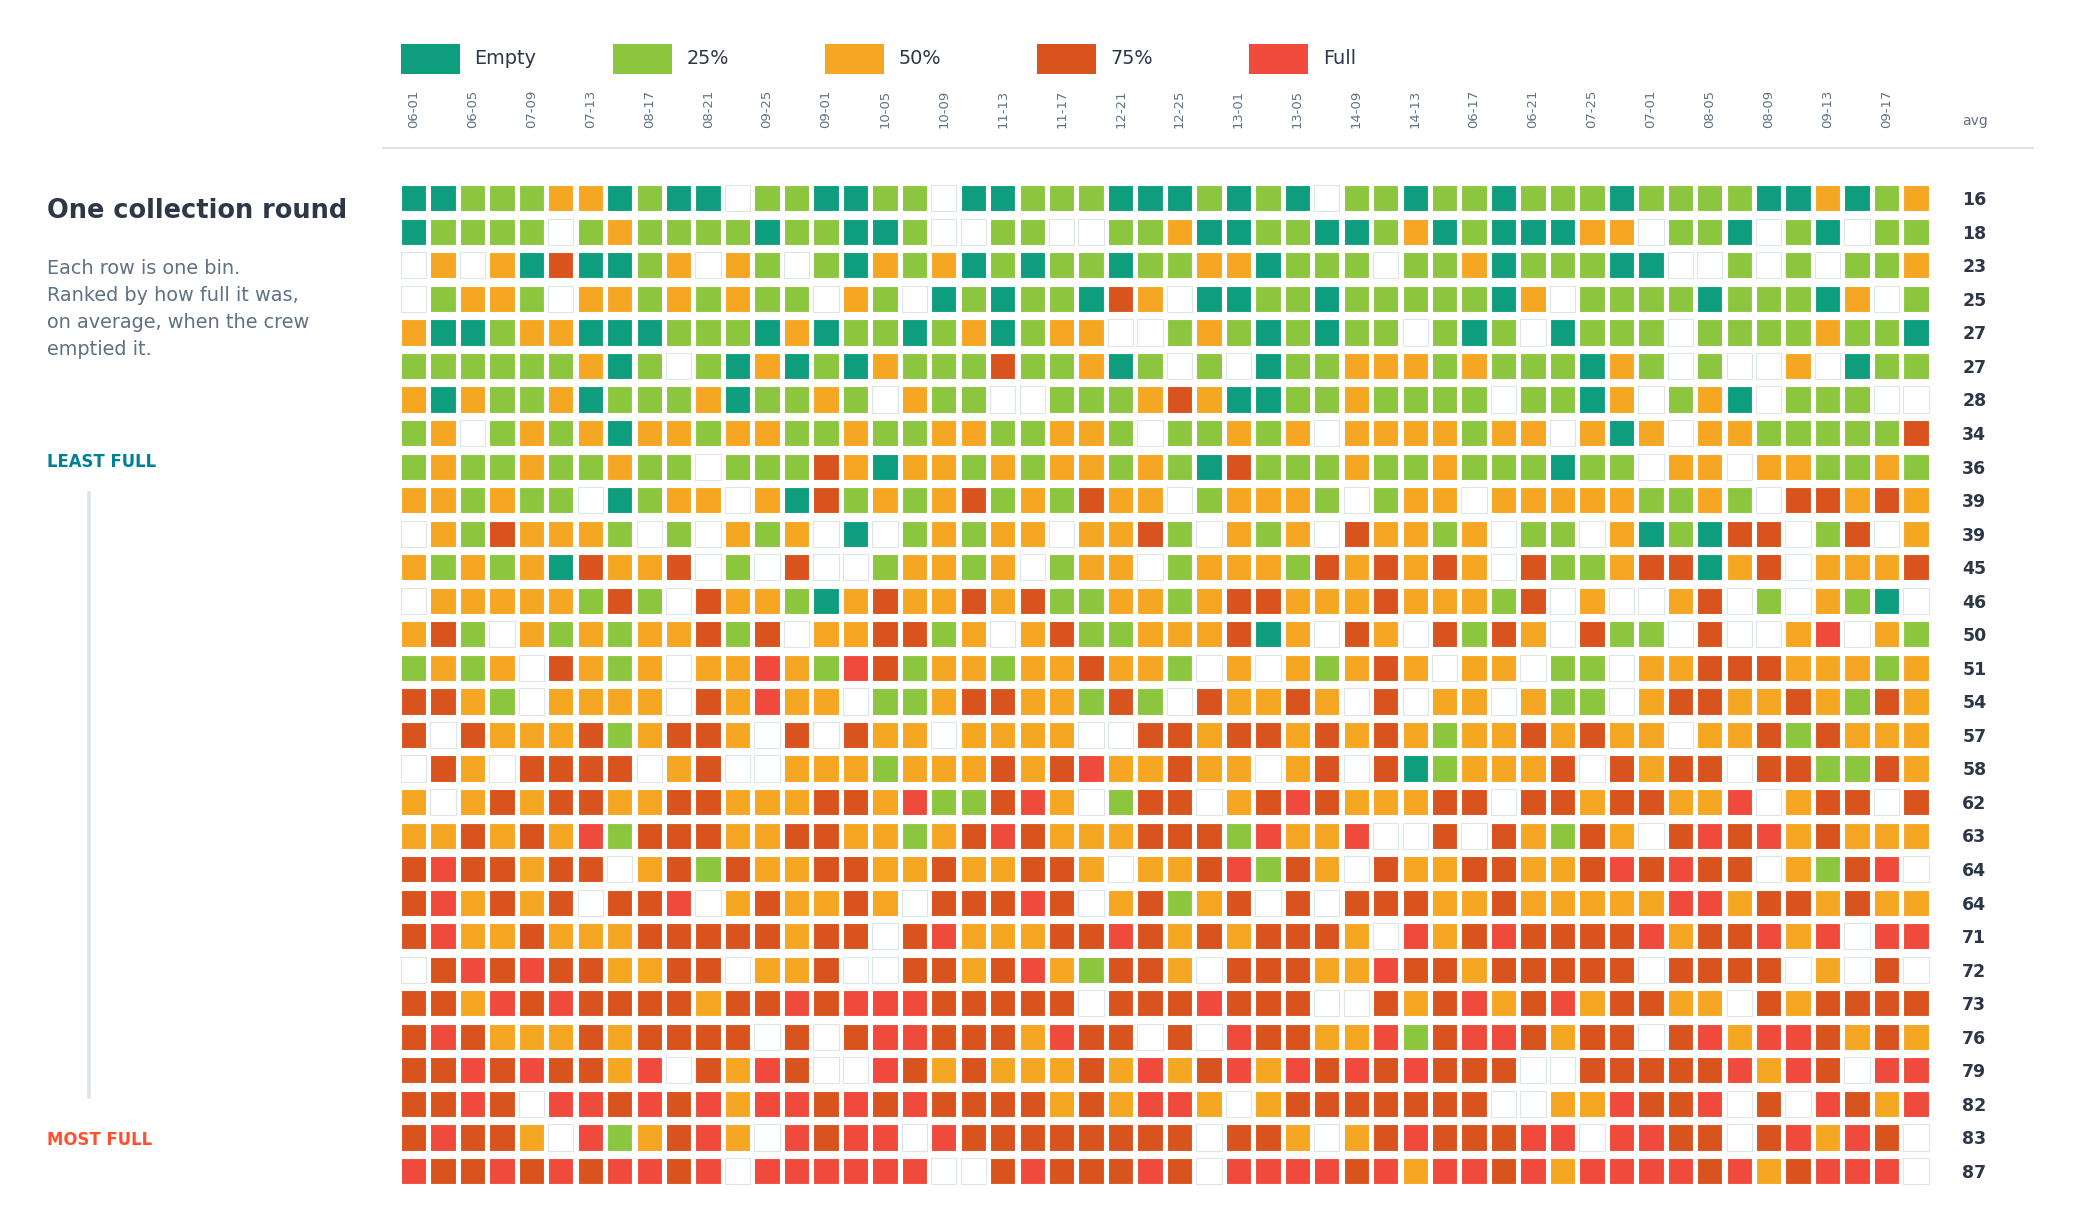
Illustrative example. Ten weeks of one collection round. Each column is a service day, each row a bin. Green is empty, red is full.
Round sequencing
What order should the crew work the round in?
An inspection round has an order on screen, and an order the crew actually walks. They are rarely the same, and the one on screen is usually whatever order the assets happened to be added in.
Because every completed inspection carries a timestamp, the real route can be reconstructed from your own records, without anyone following the crew around with a stopwatch.
What this reveals
Where the round doubles back on itself, and by how far. Often the crew have already worked out a good route, in which case the value is different: it gets written down, so it survives the person leaving and a new starter is useful on day one. And where the order on screen disagrees with the walk, that gets fixed, because a list in the wrong order is no help to whoever is working it.
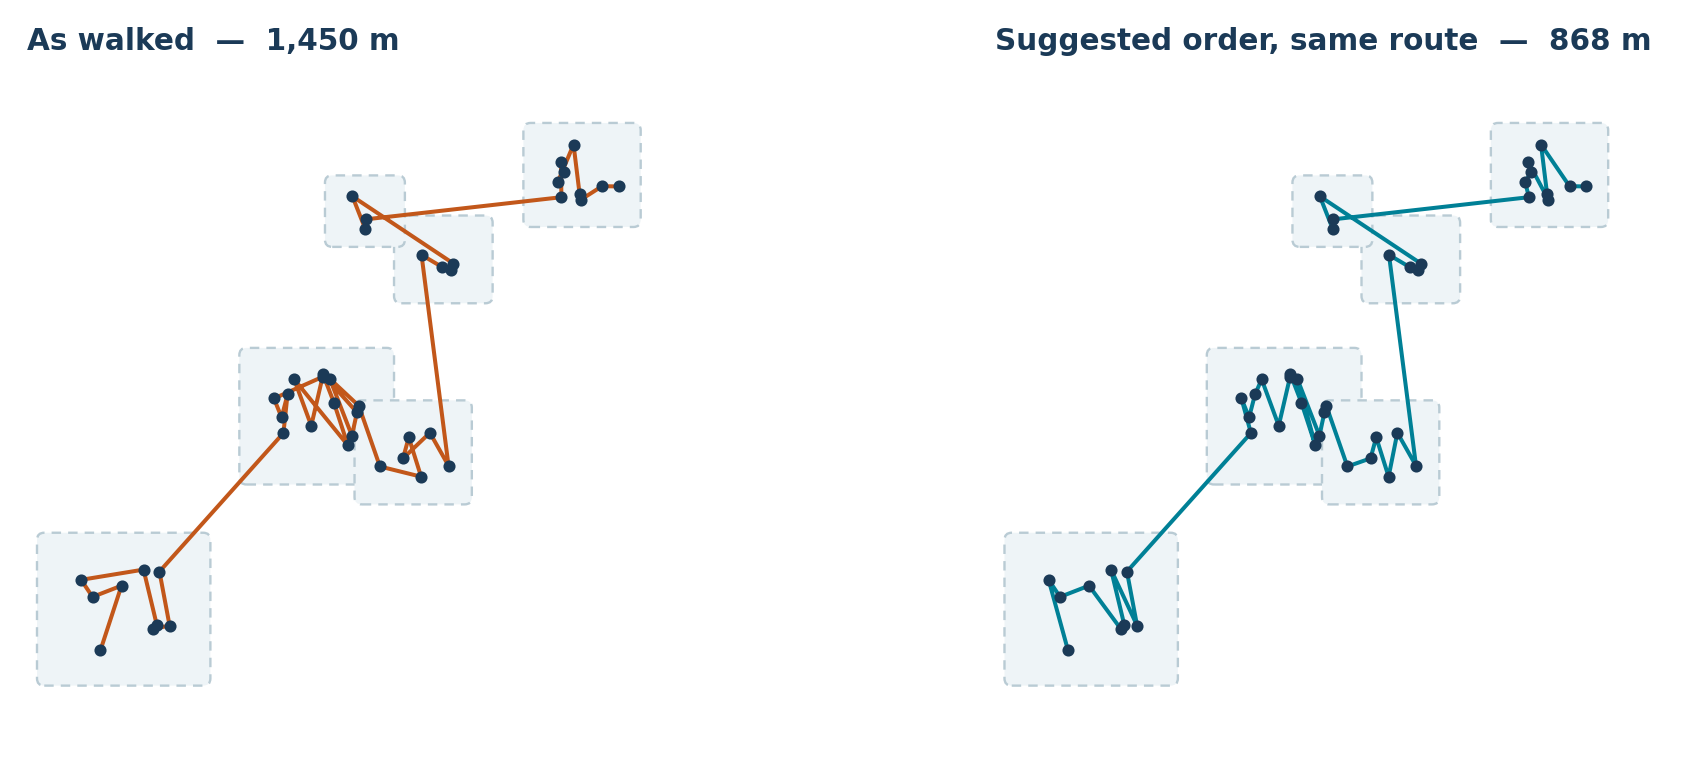
Illustrative example. The same round in two orders, reconstructed from the timestamps on the crew's own completed inspections.
Grounds maintenance
How much grounds work do you have, and is it being done?
Ask most councils how many verges they cut and the honest answer is a folder of printouts and somebody's memory. That matters three times over: when the work goes out to tender, when it gets planned, and when you need to know a contractor did what you paid for.
A verge estate, as mapped by the team who look after it:
What this reveals
What you own. Every verge, measured, with a total area and a ward breakdown. That is the schedule of works a tender needs, and it is the part that normally takes weeks to compile and is most often wrong.
How it should be organised. The estate divided into rounds a crew can genuinely finish in a day, sequenced in cutting order, so a season can be resourced and budgeted rather than guessed at.
Whether it happened. Once the contract is let, each cut is a task with a location, a date and a photograph. Performance against the regime becomes a report you can run, not a complaint you have to chase.

Illustrative example. A mapped verge estate. Nobody draws this for the analysis, it comes straight out of the register.
162
verges in the schedule, every one measured rather than estimated
5.01 ha
of grass in total, broken down ward by ward
50 hrs
of crew time per cut, split into rounds of one working day each
972
verge sign-offs across a season, each one dated and photographed
Illustrative figures for an estate of this size. Quantities come straight from the register; crew time is modelled from them and states its assumptions openly, so a contractor can argue with them before they bid rather than after.
What that is actually worth.
Knowing something is only useful if it changes what happens next. These are the changes councils are looking for when they ask these questions.
Office time you get back
Compiling a schedule of works, counting what you own, writing a report for a committee. Work that takes days of somebody's week comes out of the register instead.
Crew time spent on the work
A round in the right order is less time driving and doubling back, and more time on the job itself. The gain is not a smaller team, it is a team that gets further.
Fewer miles, less fuel
Sequencing a round cuts the distance travelled between stops, and a collection schedule matched to demand means fewer journeys to bins that were not full. Smaller carbon footprint, same service.
Answers when residents ask
When somebody asks why their verge has not been cut or their bin was missed, the answer is a date and a photograph rather than a promise to look into it.
Evidence that stands up
A dated, photographed record of what was inspected and what was found is what an auditor, an insurer or an assessor actually wants. It is worth having before you need it.
Knowledge out of people's heads
The route only one person knows, the reason that bin gets done twice a week. Written down once, it survives a retirement, a resignation or a bad week.
Three rules we hold to.
An analysis that always finds a saving is a sales tool. These are the rules that keep this one worth reading.
We read what you already do first
Sometimes the answer is that your crew had it right all along. When that happens we say so, rather than dressing it up as a saving. Writing down what your team already knows has its own value, because it survives them leaving.
We never measure against a baseline nobody uses
It is easy to make a saving look large by comparing it to something no one has ever done. The comparison has to be against how the work is really done today, even when that makes the number smaller.
We tell you when there is nothing to say
A few days of readings cannot tell anyone anything, and we will say so rather than fill a report. If your data is not deep enough yet, the useful answer is what to start recording and when to ask again.
This is not a dashboard.
There is no extra screen to learn and nothing new to fill in. Insights are a piece of work we do, and a document you get back.
Features are what the software does
The asset register, the mapping, the inspection checklists, the mobile app. Your team uses those every day, and everything they record along the way becomes the raw material for the work below.
Insights are what we do with it
We take a question your council is actually asking, work it through against your own data, and hand back a report you can put in front of a committee, a contractor, or an auditor. No new screens, no new data entry.
Which question would you want answered?
These are new, and we are deliberately taking on a few councils at a time while the methods settle. Tell us what you would want to know about your estate and we will tell you honestly whether your data can answer it yet.
Charts and figures on this page are illustrative, and show the shape of what an analysis produces rather than any one council's results.